
터칭 데이터
Spark DataFrame 실습 1 본문
Contents
1. Spark 데이터 처리
2. Spark 데이터 구조: RDD, DataFrame, Dataset
3. 프로그램 구조
4. 개발/실습 환경 소개
5. Spark DataFrame 실습
Spark DataFrame 실습
앞서 배운 내용들을 바탕으로 다양한 코딩 연습을 해보자
실습 1. 워밍업 - 헤더가 없는 CSV 파일 처리하기
입력 데이터: 헤더 없는 CSV 파일
https://s3-geospatial.s3-us-west-2.amazonaws.com/1800.csv
데이터에 스키마 지정하기
SparkConf 사용해보기
measure_type값이 TMIN인 레코드 대상으로 stationId별 최소 온도 찾기
판다스와 비교

csv 파일 상위 4개 레코드 샘플로 헤더가 없는 상태
실습
헤더가 없는 csv 파일을 다운로드 받아 Spark에 DataFrame으로 로딩해 스키마를 지정하고 SparkSession을 만들 때 SparkConf를 이용해 환경설정을 합니다.
실제로 해볼 작업은 필터링을 하고 특정 키를 기준으로 GroupBy를 한 뒤 Aggregation 함수로 최소값을 구합니다.
기본 세팅
!pip install pyspark==3.3.1 py4j==0.10.9.5
코랩에서 pyspark와 py4j를 설치합니다.
!wget https://s3-geospatial.s3-us-west-2.amazonaws.com/1800.csv
사용할 데이터가 담긴 csv 파일을 다운 받습니다.
!ls -tltotal 68
drwxr-xr-x 1 root root 4096 Jan 12 19:20 sample_data
-rw-r--r-- 1 root root 62728 Apr 10 2022 1800.csv
파일이 제대로 다운 받아졌는지 확인합니다.
!head -5 1800.csvITE00100554,18000101,TMAX,-75,,,E,
ITE00100554,18000101,TMIN,-148,,,E,
GM000010962,18000101,PRCP,0,,,E,
EZE00100082,18000101,TMAX,-86,,,E,
EZE00100082,18000101,TMIN,-135,,,E,
헤더가 없고 컬럼이 8개가 있습니다. 우리가 필요한 컬럼은 3개이지만 판다스에서는 처음 4개의 컬럼만 로딩해보겠습니다. Spark에서는 8개의 컬럼 모두 로딩해보겠습니다.
판다스 데이터프레임으로 처리해본다
import pandas as pd

pd_df = pd.read_csv(
    "1800.csv",
    names=["stationID", "date", "measure_type", "temperature"],
    usecols=[0, 1, 2, 3]
)
1800.csv 파일로 판다스 데이터프레임을 생성합니다. 이 때 사용할 컬럼은 usecols로 처음 4개의 컬럼입니다. 첫 컬럼의 인덱스는 0부터 시작합니다. 각 컬럼의 이름을 names 리스트로 각각 지정했습니다.
pd_df.head()
우리가 풀 문제는 measure_type이 TMIN인 레코드만 모아 stationID별로 최소 온도를 계산하는 것이었습니다.
# Filter out all but TMIN entries
pd_minTemps = pd_df[pd_df['measure_type'] == "TMIN"]
measure_type이 TMIN인 레코드들만 pd_minTemps라는 이름의 데이터프레임으로 가져왔습니다.
pd_minTemps.head()
pd_minTemps의 첫 5개의 레코드입니다. measure_type이 TMIN만 존재합니다.
# Select only stationID and temperature
pd_stationTemps = pd_minTemps[["stationID", "temperature"]]
measure_type이 TMIN인 레코드들의 모임인 pd_minTemps 데이터 프레임에서 stationID와 temperature 컬럼으로만 이루어진 pd_stationTemps라는 데이터 프레임을 생성합니다.
# Aggregate to find minimum temperature for every station
pd_minTempsByStation = pd_stationTemps.groupby(["stationID"]).min("temperature")
pd_minTempsByStation.head()
그리고 이를 이용해 stationID별로 temperature 컬럼의 값이 최소인 경우의 레코드들을 상위 5개만 표시하니 2개만 뜨는 것을 볼 수 있습니다. 이는 measure_type 컬럼이 TMIN인 station은 2개 밖에 없다는 뜻입니다. 2개 뿐인 station을 살펴보니 한 곳은 최저기온이 -135, 다른 하나는 -148입니다.
Spark으로 처리해본다
판다스로 한번 처리해보았으니 Spark으로 처리해보겠습니다.
판다스와 Spark의 차이에 대해 한번 더 복습할 겸 간단히 짚고 넘어가겠습니다.
먼저 데이터 크기의 차이가 있습니다. Spark는 기본적으로 다수의 서버로 구성된 프레임워크이므로 처리할 수 있는 데이터의 크기가 큽니다. 판다스는 하나의 서버로 구성되어 상대적으로 처리할 수 있는 데이터의 크기가 작지만 처리할 데이터의 크기가 작다면 훨씬 더 간단하고 빠릅니다.
상황에 맞게 유연하게 사용하시면 됩니다. 다만 Spark이 빅데이터 관련 종합선물처럼 여러 기능을 제공하므로 이 점은 기억해주세요.
from pyspark.sql import SparkSession
from pyspark import SparkConf

conf = SparkConf()
conf.set("spark.app.name", "PySpark DataFrame #1")
conf.set("spark.master", "local[*]")

spark = SparkSession.builder\
        .config(conf=conf)\
        .getOrCreate()
이번에는 SparkSession을 생성할 때 SparkConf도 같이 사용할 것이므로 SparkConf도 import 했습니다.
SparkConf 객체 생성 후 appName을 지정하고 master를 세팅하며 구글 Colab에 있는 모든 CPU 수 만큼 executor를 만들도록 했습니다.
이를 사용해 SparkSession을 만들었습니다.
지난 시간 SparkSession 생성
from pyspark.sql import SparkSession

spark = SparkSession.builder\
        .master("local[*]")\
        .appName('PySpark Tutorial')\
        .getOrCreate()
지난 시간에는 SparkConf 없이 master와 appName을 설정하며 SparkSession을 생성했습니다.
다운 받은 csv파일을 Spark DataFrame으로 로딩하는데 방법이 2개 있습니다.
df = spark.read.format("csv").load("1800.csv") # spark.read.csv("1800.csv")
주석 처리된 숏폼(short form)과 코드인 롱폼(long form)이 있습니다.
숏폼은 spark.read.csv()안에 파일 경로를 주는 것입니다. HDFS path여도 좋고 S3를 HDFS처럼 사용한다면 S3 path여도 좋습니다. 우리는 LocalStandalone 모드에서 로컬의 파일을 읽는 것이므로 1800.csv로 주어도 좋습니다.
롱폼은 saprk.read.format(파일 형식).load(파일 경로)를 줍니다.
어떤 방법을 선택해도 Spark DataFrame이 생성됩니다.
Spark DataFrame은 이 데이터 프레임의 스키마를 어떻게 이해하는지 printSchema()로 호출해보겠습니다.
df.printSchema()root
|-- _c0: string (nullable = true)
|-- _c1: string (nullable = true)
|-- _c2: string (nullable = true)
|-- _c3: string (nullable = true)
|-- _c4: string (nullable = true)
|-- _c5: string (nullable = true)
|-- _c6: string (nullable = true)
|-- _c7: string (nullable = true)
내용을 보니 Spark이 임의로 컬럼 이름을 만들고 타입도 임의로 지정했습니다.
컬럼(필드)의 이름을 지정하는 방법에는 간단한 방법과 제대로 스키마를 지정하는 등 여러 방법이 있습니다.
간단한 방법
df = spark.read.format("csv")\
    .load("1800.csv")\
    .toDF("stationID", "date", "measure_type", "temperature", "_c4", "_c5", "_c6", "_c7")
앞의 방법과 동일하게 DataFrame을 로딩하는데 이 때 toDF를 사용해 8개의 컬럼명을 지정했습니다.
df.printSchema()root
|-- stationID: string (nullable = true)
|-- date: string (nullable = true)
|-- measure_type: string (nullable = true)
|-- temperature: string (nullable = true)
|-- _c4: string (nullable = true)
|-- _c5: string (nullable = true)
|-- _c6: string (nullable = true)
|-- _c7: string (nullable = true)
지정한 대로 4개의 컬럼이 지정한 이름대로 컬럼명을 갖습니다.
단 타입은 여전히 디폴트로 string으로 되어있습니다.
df = spark.read.format("csv")\
    .option("inferSchema", "true")\
    .load("1800.csv")\
    .toDF("stationID", "date", "measure_type", "temperature", "_c4", "_c5", "_c6", "_c7")
option으로 inferSchema를 True로 설정했습니다. 원래 inferSchema는 False로 설정되어있는데 이를 바꾼 것입니다. inferSchema는 타입을 추측하라는 명령입니다. Spark에게 DataFrame을 만들 때 몇 개의 레코드를 샘플링해 컬럼의 타입을 지정하도록 합니다.
df.printSchema()root
|-- stationID: string (nullable = true)
|-- date: integer (nullable = true)
|-- measure_type: string (nullable = true)
|-- temperature: integer (nullable = true)
|-- _c4: string (nullable = true)
|-- _c5: string (nullable = true)
|-- _c6: string (nullable = true)
|-- _c7: string (nullable = true)
아까와 같이 모든 컬럼 타입이 string이 아닌 것을 볼 수 있습니다.
자세하게 지정하는 방법
from pyspark.sql.types import StringType, IntegerType, FloatType
from pyspark.sql.types import StructType, StructField

schema = StructType([ \
                     StructField("stationID", StringType(), True), \
                     StructField("date", IntegerType(), True), \
                     StructField("measure_type", StringType(), True), \
                     StructField("temperature", FloatType(), True)])
schema라는 StructType 객체를 생성한 후 StruckType을 StructField로 채웁니다. StructField는 3개의 파라미터를 갖습니다. 첫 번째는 이름, 두 번째는 타입, 세 번째는 NULL값이 가능한지 여부입니다.
stationID 컬럼은 StringType, date 컬럼은 IntegerType, temperature 컬럼은 FloatType 타입으로 3개의 타입을 사용했는데 이 외에도 다양한 타입들이 존재합니다.
# df = spark.read.schema(schema).format("csv").load("1800.csv")
df = spark.read.schema(schema).csv("1800.csv")
우리가 만든 schema StructType을 이용해 다시 csv 파일을 Spark DataFrame으로 로딩하겠습니다. 이번에는 schema라는 메서드를 호출해 우리가 만든 schema를 인자로 주었습니다.
위의 코드에서는 숏폼을 사용했지만 주석처리된 롱폼으로도 가능합니다.
df.printSchema()root
|-- stationID: string (nullable = true)
|-- date: integer (nullable = true)
|-- measure_type: string (nullable = true)
|-- temperature: float (nullable = true)
스키마를 확인하니 우리가 원하는 4가지 컬럼에 대해서만 컬럼 이름과 타입이 지정한대로 들어갔습니다.
measure_type이 TMIN인 것만 필터링하겠습니다.
3 가지 방법을 살펴보겠습니다.
# Filter out all but TMIN entries
minTemps = df.filter(df.measure_type == "TMIN")
첫번째는 DataFrame의 filter 메서드를 사용합니다.
파라미터로 조건을 줍니다. measure_type == "TMIN"이 true인 레코드만 남깁니다.
minTemps.count()730
조건에 맞는 레코드의 수는 730개 입니다.
이번에는 filter가 아닌 where를 사용했습니다.
# Column expression으로 필터링 적용
minTemps = df.where(df.measure_type == "TMIN")minTemps.count()730
where에서는 방식이 2개로 나뉘는데 첫번째는 filter때와 마찬가지로 boolean 형태로 적어주는 방식입니다.
df.measure_type == "TMIN"으로 똑같이 730개의 레코드가 나왔습니다.
# SQL expression으로 필터링 적용
minTemps = df.where("measure_type = 'TMIN'")minTemps.count()730
두번째는 SQL 표현식을 사용합니다. where안에 SQL WHERE절과 똑같이 조건을 적어줍니다.
역시 730개의 레코드가 나옵니다.
중요한 것은 컬럼 이름을 지칭하는 방식이 여러개라는 것입니다.
# Aggregate to find minimum temperature for every station
minTempsByStation = minTemps.groupBy("stationID").min("temperature")
minTempsByStation.show()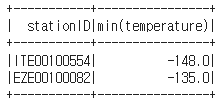
Spark 역시 stationID별로 최저 temperature를 확인하니 판다스 때와 마찬가지로 2개의 레코드가 뜨는 것을 볼 수 있습니다.
원하는 컬럼만 선택하기
여러 방법이 있습니다.
# Select only stationID and temperature
stationTemps = minTemps[["stationID", "temperature"]]
stationTemps.show(5)
첫 번째로 원하는 컬럼(들)의 이름을 리스트 형태로 DataFrame의 인덱스로 입력합니다.
stationTemps = minTemps.select("stationID", "temperature")stationTemps.show(5)
두 번째로는 DataFrame이 제공하는 select 메서드를 이용하는 것입니다. 원하는 컬럼들을 쭉 컴마로 구분해 나열해 입력합니다.
# Aggregate to find minimum temperature for every station
minTempsByStation = minTemps.groupBy("stationID").min("temperature")
minTempsByStation.show()
우리가 위에서 만든 minTempsByStation DataFrame을 파이썬 쪽으로 collect()를 이용해 가져오겠습니다.
# Collect, format, and print the results
results = minTempsByStation.collect()
for result in results:
print(result[0] + "\t{:.2f}F".format(result[1]))ITE00100554 -148.00F
EZE00100082 -135.00F
results라는 이름의 리스트로 가져와 반복문으로 print 했습니다. result에는 2개의 컬럼 stationID와 min(temperature)이 있었습니다.
반복문에서 사용된 result의 타입은 Row입니다.
Spark SQL로 처리해보기
판다스와 Spark로 처리해보았으니 Spark SQL로도 같은 작업을 처리해보겠습니다.
df.createOrReplaceTempView("station1800")
앞서 만든 df라는 DataFrame을 station1800이라는 테이블로 만듭니다.
results = spark.sql("""SELECT stationID, MIN(temperature)
FROM station1800
WHERE measure_type = 'TMIN'
GROUP BY 1""").collect()
measure_type 컬럼이 TMIN인 레코드들 중에서 같은 stationID별로 최저 temperature를 구하는 쿼리문을 입력해 sql에 인자로 주면 DataFrame이 만들어지고 이를 collect를 사용해 파이썬 드라이버 쪽으로 가져옵니다.
# pyspark.sql.Row는 DataFrame의 레코드에 해당하며 필드별로 이름이 존재#
for r in results:
    print(r)
Row(stationID='ITE00100554', min(temperature)=-148.0)
Row(stationID='EZE00100082', min(temperature)=-135.0)
파싱이 되지 않은 상태로 print 되는데 Row 타입이고 컬럼=값 형태입니다.
pyspark에서 제공하는 타입들에 대해 다뤄봅니다.
pyspark.sql.types
완전한 내용은 위의 링크를 참고하세요.
IntegerType
LongType
FloatType
StringType
BooleanType
TimestampType
DateType
ArrayType
StructType
실습에서 보았듯이 보통 StructType을 하나 정의하고 그 안을 여러 StructField로 채웁니다.
StructField
MapType
DataFrame의 컬럼을 지칭하는 방식
from pyspark.sql.functions import col, column
stationTemps = minTemps.select(
"stationID",
col("stationID"),
column("stationID"),
minTemps.stationID
)
col과 column은 똑같은 역할을 합니다.
minTemps라는 DataFrame에서 원하는 컬럼을 선택하는 방법들을 코드로 나타낸 것입니다.
"stationID"와 같이 스트링으로 적어도 되고
col이나 column함수를 불러 지칭해도 되며
아니면 데이터프레임이름.컬럼이름 과 같이 지칭해도 됩니다.
모두 동일한 방식이라는 것을 기억해주세요.
'하둡과 Spark' 카테고리의 다른 글
| Spark DataFrame 실습 3 (4) | 2024.01.17 |
|---|---|
| Spark DataFrame 실습 2 (0) | 2024.01.17 |
| Local Standalone REP 데모 - 윈도우(Windows) (0) | 2024.01.16 |
| Local Standalone REP 데모 - 맥(Mac) (0) | 2024.01.16 |
| 개발환경소개 Colab 설정과 코딩 데모 (0) | 2024.01.16 |


